Access Informatics is a unique solution that illustrates the story of patient access in your organization through a partnership with our industry experts to deliver optimized staff forecasting, analytical performance reviews, and industry benchmarking. This solution is targeted at reducing costs, instilling accountability within leaders, calibrating quality reviews, and improving performance and patient satisfaction.
Access Advisors has developed a system that is highly graphical and translates overwhelming data into actionable charts. This product is designed to provide these services remotely at a very competitive cost. Outsourcing your performance and quality management oversight to an unbiased and expert third party can help reduce your budget and increase your efficiency.
How is Your Organization Analyzing Provider Schedule Productivity?
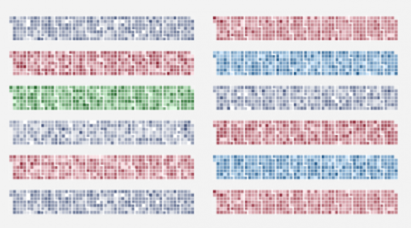
What Tools Does Your Organization Utilize to Target Opportunity?
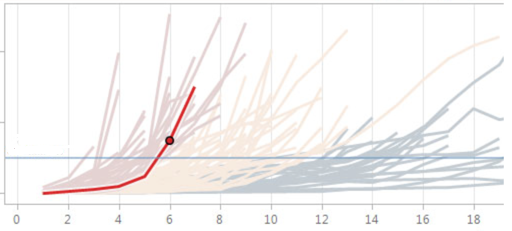
Below are a few examples of the key questions Access Informatics can answer for your organization.
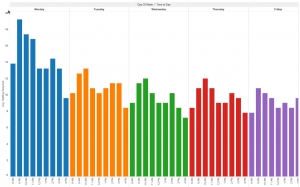
If the contact center is primarily staffed with full-time employees, contact center staffing is likely not optimized. We use sophisticated tools that measure call volumes within 30 minute historical segments, account for upcoming call spikes, and include work required by the contact center that is not related to phone activity. In fact, our system informs call center leadership when to complete the off-phone work to maximize service and reduce the abandonment rate.
The following illustration shows our basic staffing analysis required for the upcoming week. If off-phone work is required in the contact center, this would be accompanied by a staff schedule to optimize the following week’s performance.
Contact center leaders can now focus on agents not meeting expectations and potentially driving down patient satisfaction. The EPR analysis is only one of numerous reports provided to allow targeted coaching of employees.
The following illustration shows that agents 4, 5, and 7 are not performing to benchmark expectations and will lead to further analysis by Access Informatics.
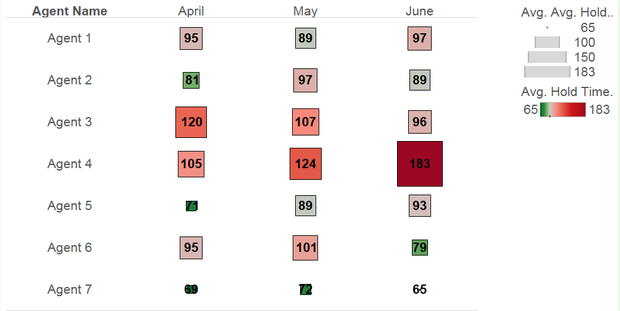
For example, one of the metrics closely tied to negative patient perceptions is excessive hold time. This metric is benchmarked against other organizations and best practices are reached through various research studies.
The following illustration is used to assess hold times against these indicators. The team shown here is struggling to maintain the benchmark for hold times. In addition, Agent 4 has unacceptable hold times and is also showing an increase each month. A specific program and timeline would be developed for the agents to improve their performance.
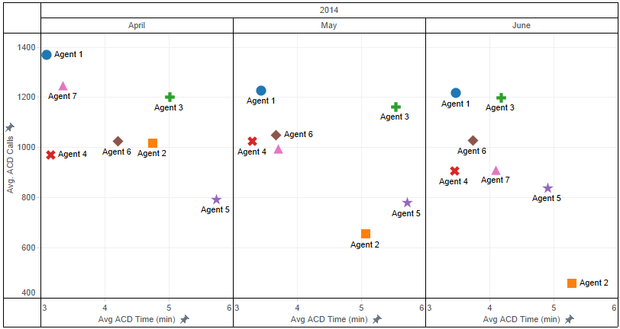
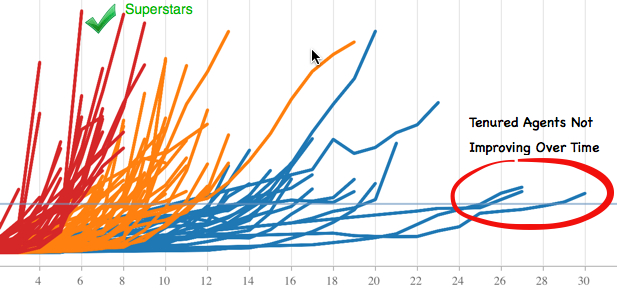
The following is an example of peer benchmarking that shows the agents within standard deviation of the benchmarked activity. It also shows the agents that are well outside this standard deviation and would trigger a further analysis.
In the first illustration, we compare the agents’ volume of calls answered with their handle time to identify outliers. Here, we can see that Agent 2 has high handle times and low volume, indicating low contribution to the team and a knowledge gap on how to handle calls efficiently. You can also see the performance has been declining over the last three months.
In the second illustration, we trend agents against numerous performance targets to identify both top tier agents and those agents that are not progressing according to benchmarks. This information is paramount to providing leaders with targeted coaching opportunities.
Schedule a Consultation
that will Optimize Your Practice


